If you’ve ever opened a trading chart and seen a random line moving under the price graph, that’s probably the Relative Strength Index, or RSI. It may look mysterious, but once you get it, it’s basically your trading sixth sense.
Using RSI is a quick way to tell when an asset is being overhyped or unfairly beaten down. Whether you’re a complete beginner or want to learn better chart analysis, RSI is one of those tools every trader should understand.
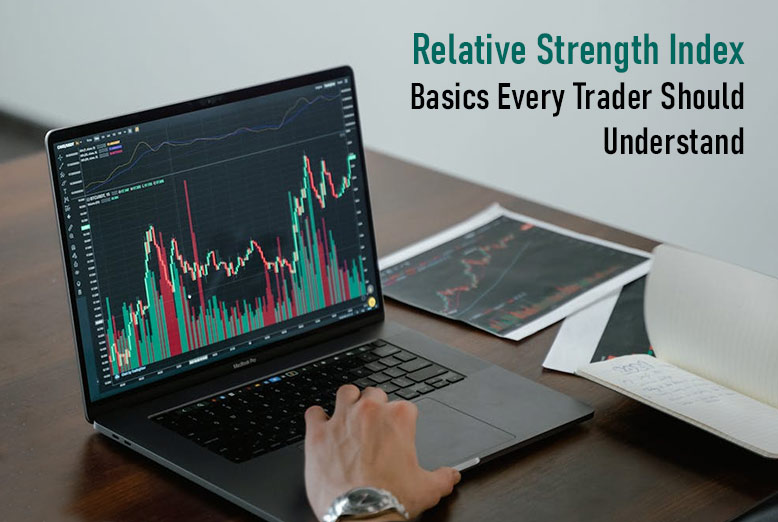
Let’s break down the essentials.
What Is the RSI?
The Relative Strength Index (RSI) is a momentum oscillator that measures how fast and how much the price of an asset changes over time. It’s shown as a line that moves between 0 and 100, and it helps traders figure out if an asset is overbought or oversold.
An RSI of above 70 means the asset might be overbought, but the price could drop soon. Similarly, an RSI below 30 is an indicator of the asset being oversold, and the price could bounce back.
Basically, it tells you when traders might be getting too greedy or too scared.
How RSI Works
RSI compares the average gains and losses of an asset over a certain period, which is usually 14 days. It converts that information into a number between 0 and 100. And this number tells you whether the buying or selling pressure is stronger.
So, instead of manually tracking all of those details, you just take a look at RSI and understand how the market is responding – and how you need to respond.
Why RSI Is So Popular
There are tons of technical indicators out there, but traders love RSI because it’s easy to read, it helps identify potential reversals, and it works across any market, be it stocks, forex, or crypto. RSI also complements other indicators really well, especially moving averages.
It’s one of those fundamentals that you keep using no matter how advanced you get at trading or investing. And if you’re trading with borrowed funds through a margin account, RSI becomes even more important.
Margin trading magnifies both profits and losses, so knowing what is a margin account is equally important and as crucial as learning about RSI.
Key RSI Levels
When RSI climbs above 70, it’s officially in the overbought zone. It means the price has been rising too fast. Traders may start taking profits, leading to a pullback. For example, if an asset’s RSI hits 80, it doesn’t mean it will crash, but it is a red flag that the uptrend might be getting tired.
If RSI is below 30, the asset is in the oversold zone. It suggests heavy selling pressure, and could mean the price is too low. At this level, a rebound may be coming soon.An RSI level of 50 is the middle ground. It’s basically the “neutral” zone that helps confirm the direction of a trend. If it’s above 50, that’s bullish momentum, and below 50 is bearish momentum.
Also read : Why the Breadth of Market Movement Matters for Long-Term Investors